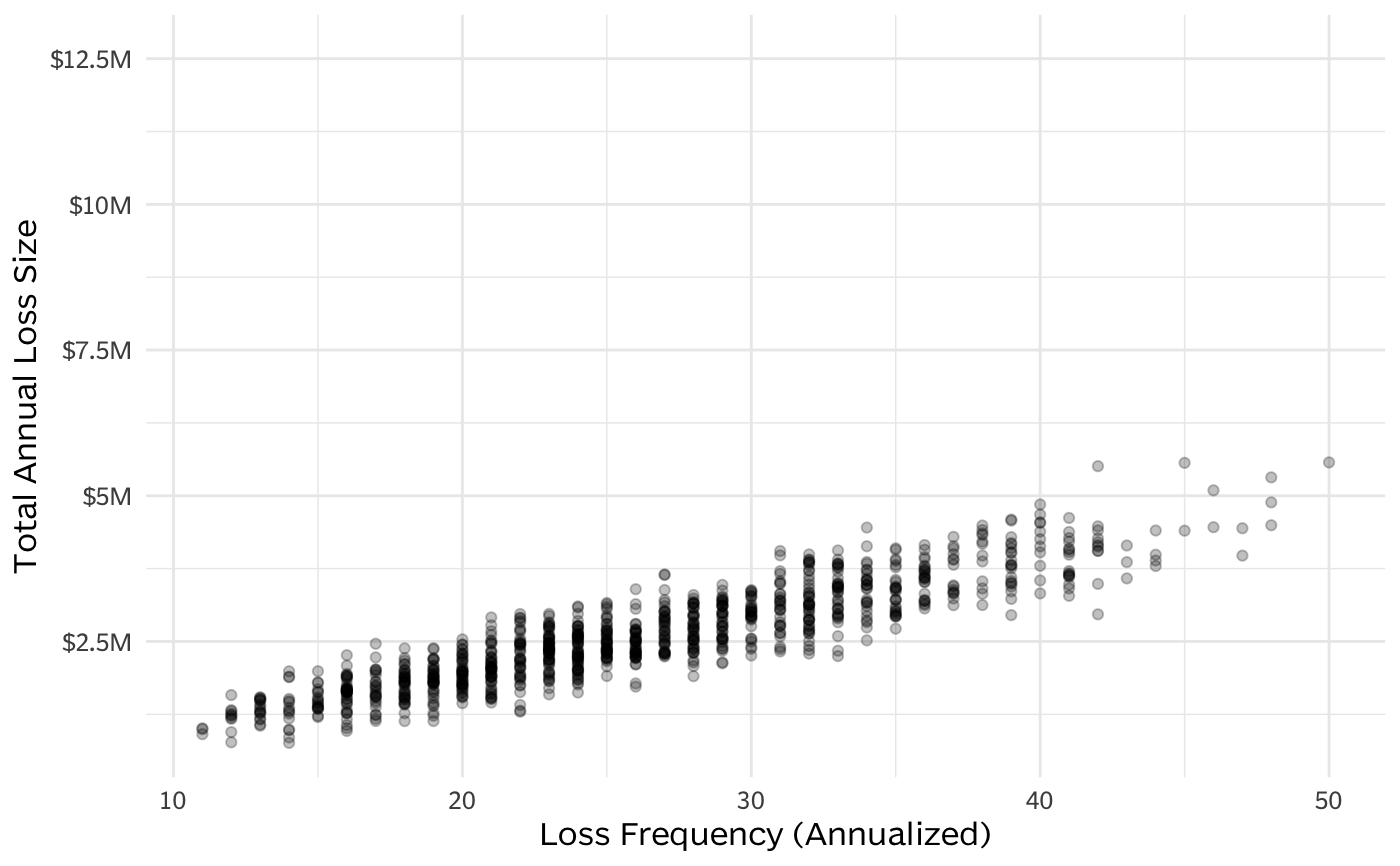
Display a scatterplot for a particular scenario ID
generate_scatterplot.RdGiven a detailed results dataframe and a specific scenario identifier, create a scatterplot of the number of loss events versus the total amount of expected annual loss expected for each simulation. This provides a detailed view on the results for a particular scenario.
generate_scatterplot(simulation_results, scenario_id)
Arguments
| simulation_results | Simulation results from |
|---|---|
| scenario_id | ID of the scenario to display. |
Value
A ggplot object.