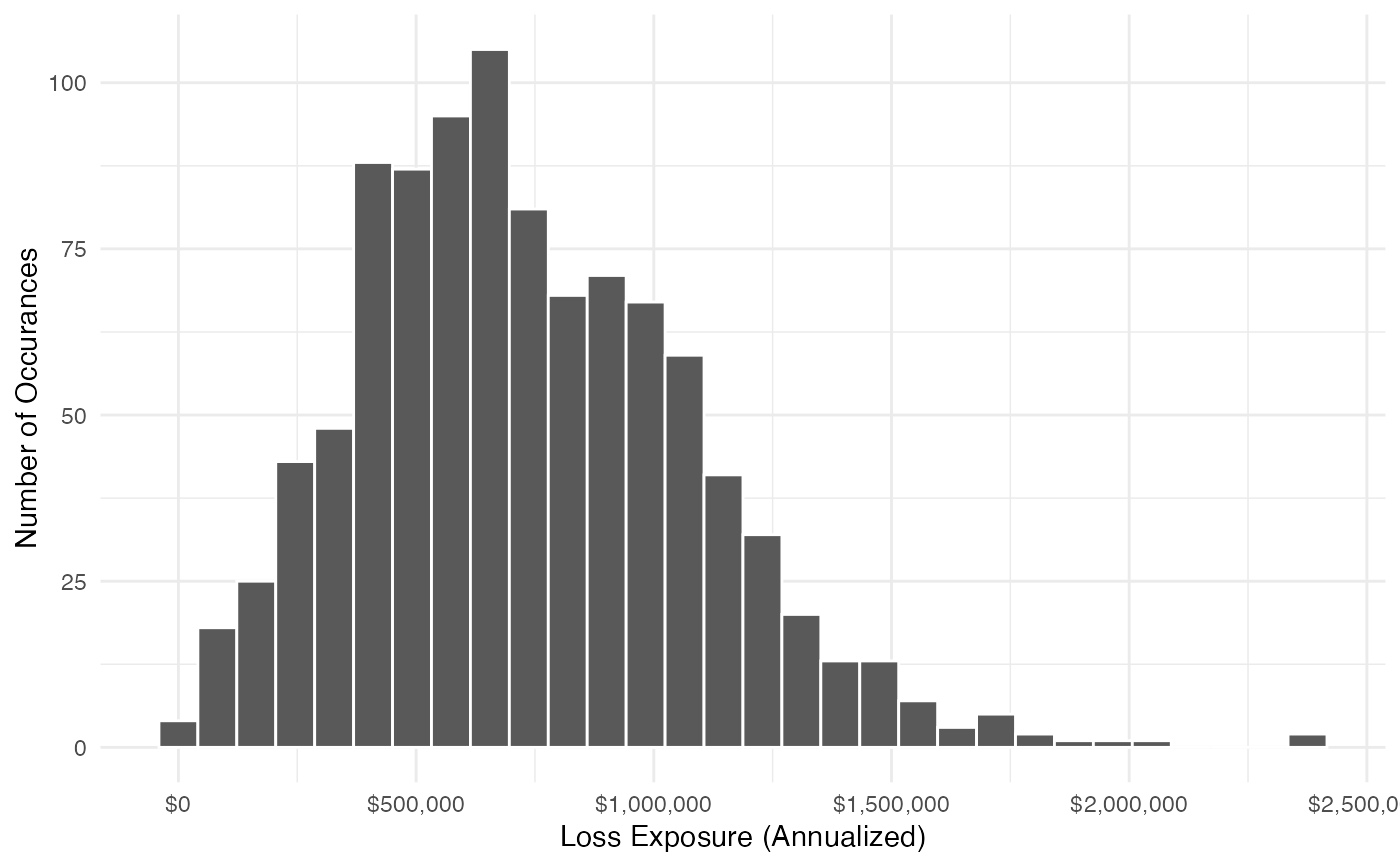
Given a results dataframe for a specific scenario, create a histogram of the annualized loss exposure. This provides a detailed view on the results for a particular scenario.
exposure_histogram(simulation_result, bins = 30, show_var_95 = FALSE)Arguments
- simulation_result
Simulation result from
run_simulation.- bins
Number of bins to use for the histogram.
- show_var_95
Set to TRUE to show the 95 percentile value at risk line.
Value
A ggplot object.
See also
Other result graphs:
generate_event_outcomes_plot(),
generate_heatmap(),
generate_scatterplot-deprecated,
loss_exceedance_curve(),
loss_scatterplot()
Examples
data(mc_simulation_results)
result <- mc_simulation_results$results[[1]]
exposure_histogram(result)