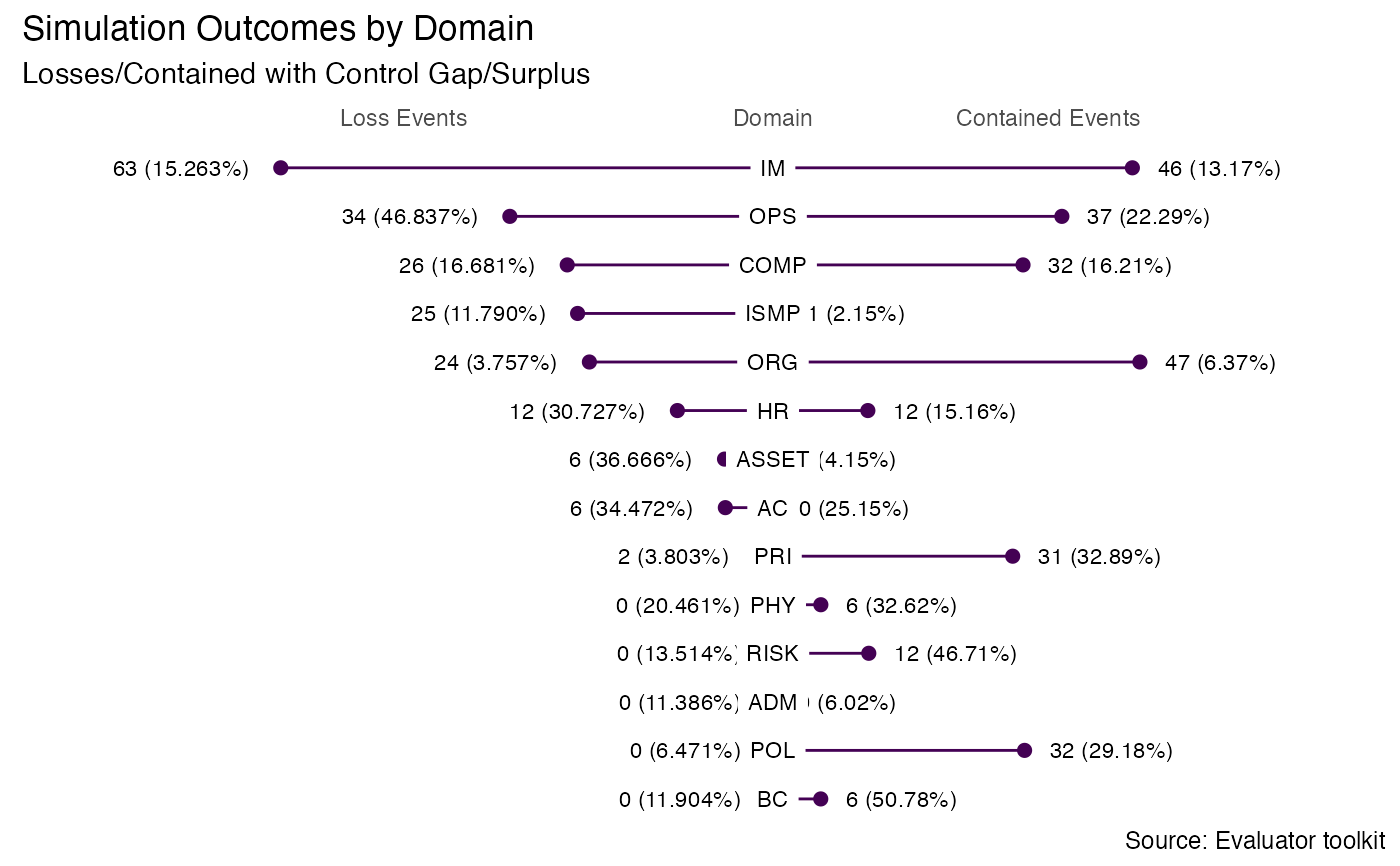
Display the distribution of threat events contained vs. realized across all domains
Source:R/common_graphs.R
generate_event_outcomes_plot.RdCreates a barbell plot showing the number and percentage of events contained (not resulting in loss) vs the number and percentage of loss events (threat events resulting in losses).
generate_event_outcomes_plot(domain_summary, domain_id = domain_id)Arguments
- domain_summary
Domain-level summary from
domain_summary.- domain_id
Variable to group plot by.
Value
A ggplot object.
See also
Other result graphs:
exposure_histogram(),
generate_heatmap(),
generate_scatterplot-deprecated,
loss_exceedance_curve(),
loss_scatterplot()
Examples
data(mc_domain_summary)
generate_event_outcomes_plot(mc_domain_summary)